Make Sense of Your Data for Cost and Utilization Analysis
Health policy managers need to understand how to transform claims data into information for various audiences. Using widely accepted categories and groupings, analysts can spotlight opportunities to reduce healthcare spending and rates of growth using language that a broad audience can understand.
The Problem
Roughly half of states use an All-Payer Claims Database (APCD) to analyze variations in cost and utilization to better understand health system performance. The volume and variety of information captured in claims data create challenges for analysis and generation of reports that identify specific policy opportunities. Organizing, or “grouping,” claims data into common service categories using standard methods supports analysis of specific policy questions and contributes to the comparability of results and more meaningful, actionable reporting.
Grouping methods developed based on standard code sets maintained and regularly updated by professional associations or government agencies have advantages over similar, commercially available tools. Regular and predictable updates reduce the cost of maintaining these methods and contribute to repeatable analyses and consistent results over time. Transparency is enhanced because technical details can be freely shared with other potential users free of acquisition, licensing, or other fees. Adopting similar methods across multiple states supports an enhanced understanding of relative health system performance and assists in identifying specific opportunities for improvement.
Case Study: The Rhode Island Cost Trends Project
As part of the Health Spending Accountability and Transparency Program (better known as Cost Trends), the Rhode Island Office of the Health Insurance Commissioner (OHIC) collaborated with FHC and the Health Care Cost Trends Steering Committee to develop interactive dashboards using Rhode Island’s All-Payer Claims Database (APCD) data, these dashboards provide public reporting on trends in the cost and use of healthcare in RI. The purpose is to inform action by provider organizations, payers, purchasers, policymakers, and state residents interested in improving the affordability of healthcare in the state. Five Cost Trends dashboards can be accessed through the OHIC Data Hub.
Dashboards show results for the five most recent calendar years, trends in measures including total spending (based on allowed amounts), units of service, per member per month (PMPM) spending, price per unit (PPU), and units per thousand members (UPK). Results can be filtered by market (payer type), age, gender, year, and other dimensions as meaningful and appropriate.
Grouping Data to Support Analysis
Cost Trends organizes claims data in groups to support analysis and dashboard development, and examples are summarized and discussed below. This blog focuses on methods used to group hospital inpatient procedures and outpatient and professional services. A future blog will discuss grouping claims data for chronic conditions, mental health services, and prescription drugs dispensed in a retail pharmacy setting.
Summary of Methods Used to Group Claims Data
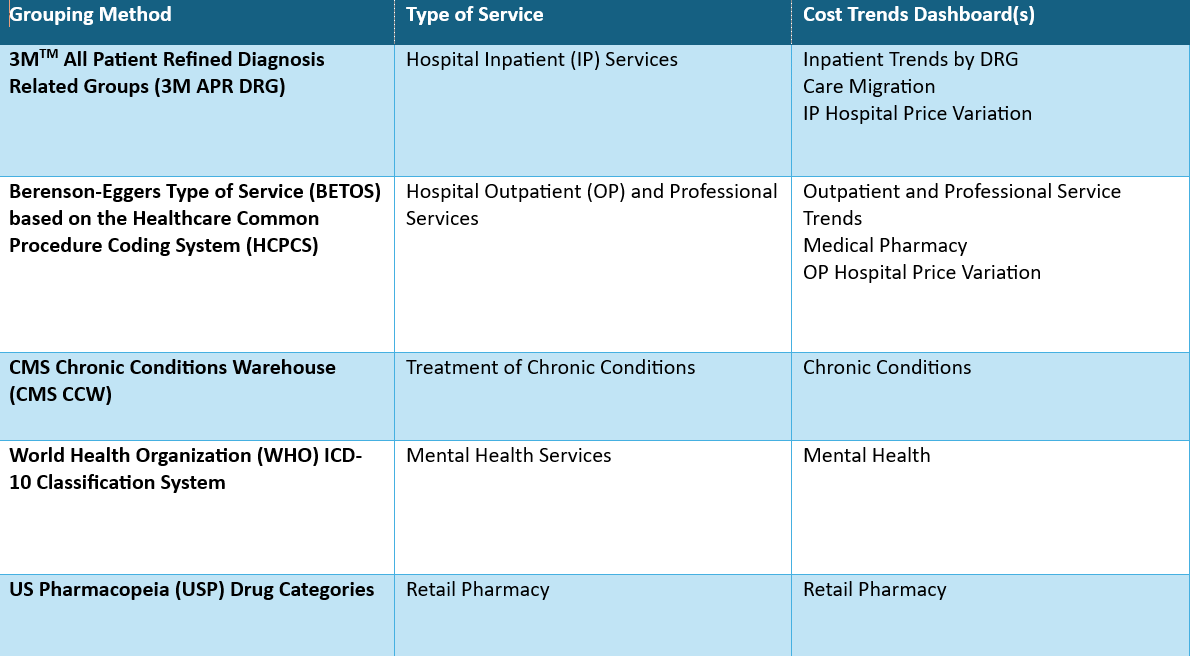
Hospital Inpatient Services
To facilitate consistent analysis and meaningful comparisons, 3MTM All Patient Refined Diagnosis Related Groups (APR DRGs) were applied and used to categorize hospital inpatient procedures based on severity of illness, risk of mortality, medical prognosis, need for intervention, and intensity of resources used in treating patients. Each APR DRG falls within a Major Diagnostic Category (MDC) that organizes illnesses into 25 mutually exclusive groups based on principal diagnoses and by medical specialty and organ system or etiology. MDCs and DRGs were assigned using the 3MTM APR DRG software.
Identifying and grouping hospital IP procedures using APR DRGs and MDCs supports consistent analysis and reporting of cost and utilization trends and facilitates meaningful comparisons across health systems, hospitals, and payer types.
Outpatient and Professional Services
FHC used the Restructured BETOS Classification System (RBCS), maintained by CMS, to categorize and analyze utilization and spending on services delivered in an outpatient facility or professional office setting. Berenson-Eggers Type of Service (BETOS) categories are assigned for each Healthcare Common Procedure Coding System (HCPCS) or Current Procedural Terminology (CPT) procedure code. The BETOS system was originally conceived in the 1980s to allow researchers to group Medicare Part B services into clinically meaningful categories.
Because the RBCS categories may be overly broad or ambiguous for some purposes, FHC applied modified type of service groupings using more intuitive, user-friendly terminology that reflects how providers and patients typically talk about healthcare. A crosswalk developed by FHC allows users to understand how RBCS categories and individual HCPCS and CPT codes map to the modified type of service groupings. This mapping is complete and includes over 15,000 service codes, capturing about 90 percent of all spending on outpatient and professional services.
Use of these methods supports more meaningful comparisons of cost and utilization across care settings, by payer type, and over time. Freedman HealthCare shares this crosswalk under a no-cost, Creative Commons license to any who wish to use it. Please contact Jonathan Mathieu, Senior Consultant, for more information on the RBCS-Type of Service crosswalk at [email protected].
Final Thoughts
Claims data is a valuable resource essential for analyzing and understanding variations in cost, utilization, quality, access to care, and many other use cases. Grouping claims data using standard methods facilitates analysis and reporting that identifies specific opportunities for improvement, supports data-driven decisions, and informs policy. Analysts using standard methods can more easily compare results over time and across states, providing further insights into health system performance and opportunities for improvement.